
Metric Data Tables
The table view of metric data shows design elements (classes, packages, etc) by row, metric values by column:
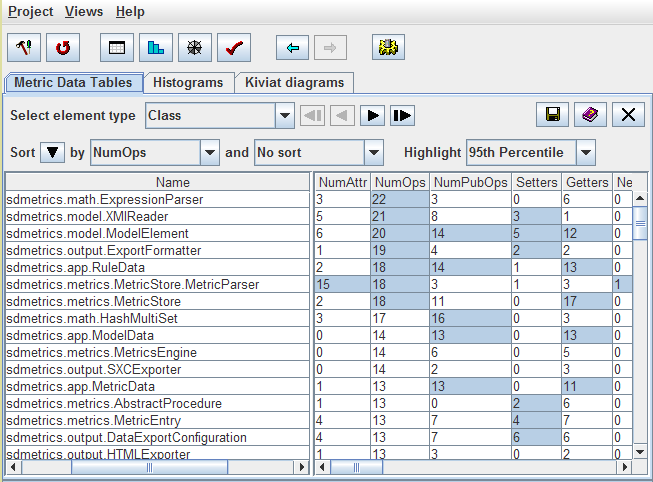
Within SDMetrics, you can sort the table by columns, to quickly identify the elements with the highest or lowest values for a particular metric. In addition, you can highlight metric values above or below a given percentile. For instance, you may choose to highlight, in each column, the top 5% highest metric values.
Histograms
The histogram view allows you to quickly browse through histograms and cumulative distribution graphs for all metrics, to get an idea of the distributions of the metrics and visually identify possible outliers:
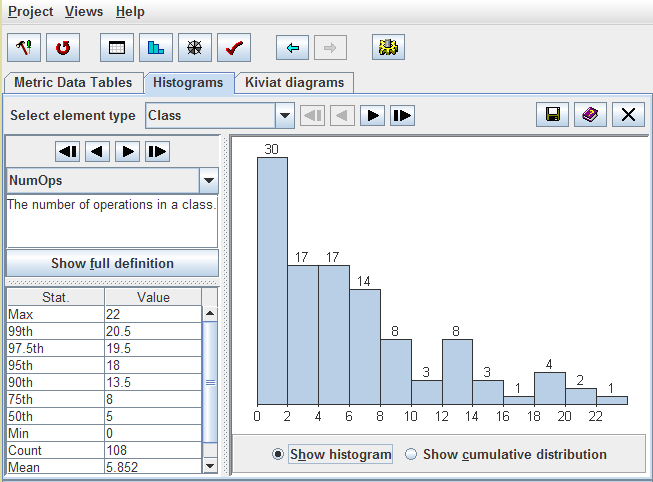
The view also provides descriptive statistics for the metric, including maximum and minimum values, mean, standard deviation, and percentiles (configurable).
Kiviat diagrams
This view shows information for one UML design element at a time. You can browse through Kiviat diagrams for all elements. The diagram shows the measurement values of all metrics for the selected element. Each axis (or ray) of the graph represents one metric, as labeled in the graph.
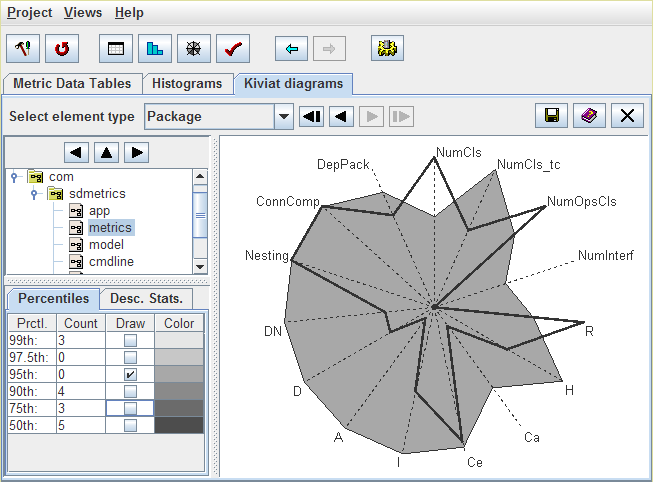
The thick line connects the metric values of the selected element for each metric on the axes. If the element has many large values, the area enclosed by the thick line will be large. So the size of the enclosed area serves as an indicator of the criticality of the element.
You can also show on the graph the percentiles of the metrics (gray areas). This gives an indication how the measurement values of the selected element compare to all other elements.
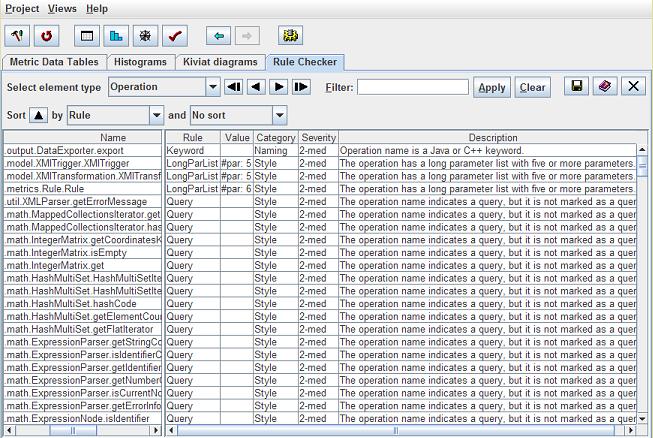
Design Rule Checking
The design rule checker lists all detected violations of design rules. You can quickly sort the list by violating element, violated rule, severity or category of the violated rule.
More Screenshots
The user manual contains additional screenshots and descriptions of all views: