Figure 9: Table view of metrics
| Prev - Next - Down | SDMetrics - the UML design measurement tool |
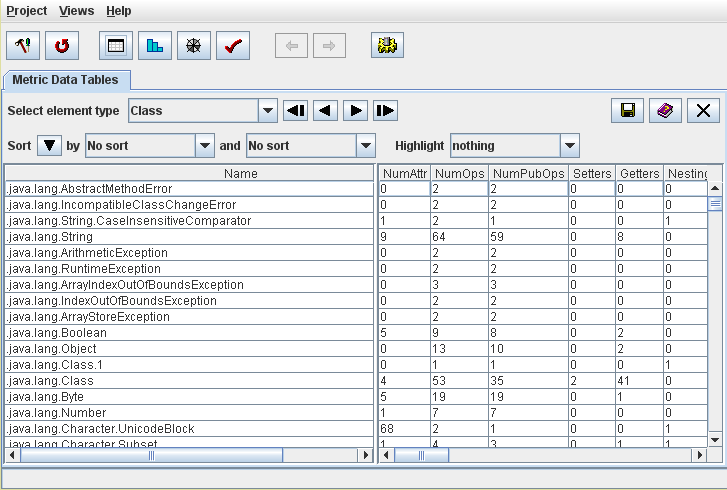
Figure 9: Table view of metrics
For large tables, use the vertical and horizontal scroll bars of the metrics table to see more columns and rows. The left hand column showing the element names always remains visible in the table view. To adjust its width, drag the separator bar between the two table sides to a suitable position.
The context menu of the table cells of the right hand side table provides links to
| Prev | Up | Next |
| Section 4.3.1 "Common controls in views" | Contents | Section 4.4.1 "Highlighting Outliers" |