

How can I effectively use the software design measures obtained with SDMetrics for decision making? Below, we summarize a number of data analysis techniques that are useful in the context of design measurement.
Descriptive statistics and dimensional analysis techniques such as principal component analysis can be used to identify a minimal, non-redundant set of metrics that is meaningful for your design practices.
This reduced set of metrics can be used for class/package rankings to identify areas with potential design problems.
Over time, you can build up a design measurement database and establish quality benchmarks.
In more mature organizations that regularly perform process measurement (fault tracking, effort data), you can use design measurement to build quality prediction models.
Descriptive Statistics
Descriptive statistics characterize the distribution of values for a design metric in terms of its mean and median value, interquartile ranges, and variance (or standard deviation).
The range and distribution of a metric determines the applicability of subsequent analysis techniques. Low variance metrics do not differentiate design elements very well and therefore are not likely to be useful predictors. Descriptive statistics allow us to determine if the data collected from two or more projects are comparable, stem from similar populations. If not, this information will likely be helpful to explain different findings across projects.
SDMetrics directly displays and exports descriptive statistics for design metrics.
Top of pageDimensional Analysis
In the discussion of structural design properties we have noted that even though metrics have been defined to capture different aspects of a software design, in practice they often are correlated with each other. That is, they measure essentially the same thing - some of the metrics are redundant.
Redundant metrics provide no new design information. They can be discarded without loss of information, and should be discarded to facilitate the use of measurement data for decision making. Design measurement tools often come with a large set of metrics, and you should expect many of metrics to be redundant. SDMetrics is no exception here.
The difficulty is that, depending on design practices used in a development environment, two metrics may be redundant in one software system, but not in another. There is no such thing as a canonical set of non-redundant metrics that captures all important design properties and is valid for all systems. Therefore, SDMetrics opts for a rich set of metrics, to lower the risk of missing important design aspects, at the prize of some redundancy among the metrics.
Techniques such as principal component analysis (PCA) can be used to identify and eliminate redundant metrics. PCA is a standard technique to identify the underlying, orthogonal dimensions (which correspond to properties that are directly or indirectly measured) that explain relations between the variables in a data set. Examples of the application of PCA are demonstrated in [BWDP00][BWL01].
Using a technique such as PCA within a few projects, you can identify a reduced set of largely orthogonal metrics for your development environment.
Top of pageRankings
Most metrics have an underlying hypothesis of the form: the higher the measurement value (e.g., size, import coupling), the stronger the negative impact on quality (fault-proneness, effort, maintainability). Therefore, when considered in isolation, design metrics only allow relative statements about the system quality, e.g. "package A displays stronger coupling than package B, therefore, package A is more likely to suffer from quality problems than package B."
An admissible interpretation is therefore to sort the model elements by a metric, and review the design of the model elements with the highest values: Are those high values justified, should the model element be considered critical?
There is no definitive answer to the question how many elements to choose for review from the top of the sorted list. One strategy could be to select so-called "outliers". Another strategy could be to select a certain number or percentage of model elements from the top, based on available resources for reviewing.
SDMetrics supports this kind of interpretation of measurement data. The histograms in the metric view allow you to visually identify outliers. In the table view, you can sort the elements by a metric, and highlight elements in the upper percentiles for a metric.
What about thresholds?
One recurring suggested use of design metrics is that they can be used to build simple quality benchmarks based on thresholds. If a design metric exceeds a certain threshold, the design element is either rejected and must be redesigned, or at least flagged as "critical". It is difficult to imagine why a threshold effect would exist between, for example, size metrics and fault-proneness. This would imply a sudden, steep increase in fault-proneness in a certain size value range, something that would be difficult to explain. Also, empirical data does not support this idea.
Top of pageQuality Benchmarks
The idea of benchmarks is to compare structural properties of a design with properties of previous system designs that are 'known to be good' and have stood the test of time. To this end, measurement values for selected design metrics obtained from previously developed, successful designs are stored in a database. If a new or modified design is to be evaluated, the same measurements are applied. Then, the distribution of each design metric is compared to the distribution of these metrics stored in the database.
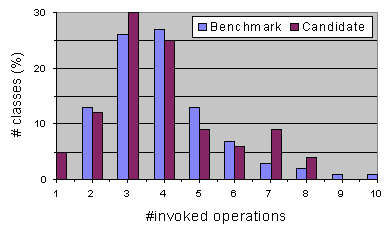
Figure 1: Benchmarking
As an example, Figure 1 shows a (fictitious) distribution of the number of operations invoked from within a class. The vertical axis indicates, for each value on the horizontal axis (number of invoked operations), the percentage of classes that have that particular value. In the example, the distribution of the new classes follows closely the distribution of the benchmark, except for values 7 and 8, which occur more frequently. Such deviations from expected distributions pinpoint potential risk areas. These areas could then be inspected to verify whether such a deviation is justified, or if a redesign of that part should be considered.
The example also illustrates why the examination of distributions provides more information than simply defining thresholds for each metric that are not to be exceeded. In the example, the number of invoked operations is not exceedingly high for the candidate design - the benchmark suggests 10 as an upper value. A simple threshold test would have missed the potential design problem for the cluster of classes with 7 and 8 operation calls.
Top of pagePrediction Models
Prediction models try to estimate the future quality of a system from internal quality attributes that are measurable at present. This is achieved by empirically exploring the relationships between internal and external quality from systems developed in the past, and applying these findings to new systems.
In the following, we describe how to build and use a prediction model for class fault-proneness from the structural properties of a class. Figure 2 depicts the steps involved in building the prediction model.
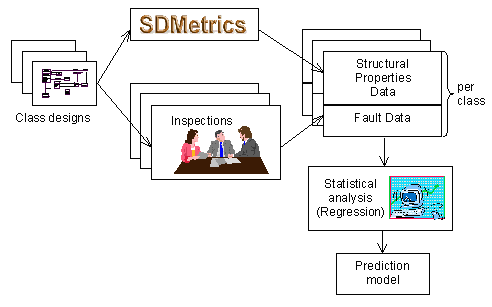
Figure 2: Building a Prediction Model
The starting point is a system design that has been created in the past. We apply SDMetrics to the design to obtain structural properties data for the classes in the design, collected from the various diagram types (class, object, collaboration, sequence, and state diagrams). In addition, fault data (e.g., from inspections, testing, or post-release faults) has to be collected and the faults per class recorded.
We now have a set of classes enriched with structural properties data and fault data. On this data set we perform a statistical analysis (e.g. classification or regression analysis) to identify relationships between fault data and structural properties. The result of this analysis is a prediction model, e.g., in the form of a regression equation. The prediction model computes a predicted fault-proneness or predicted number of faults from the structural properties of a class. This model can be used to make predictions for new classes, as depicted in Figure 3.
The starting point in applying the prediction model is a new design candidate. We apply SDMetrics to this design to again obtain the structural properties measurement data for the classes. This data is then fed into the prediction model. Using the now known relationship between the structural properties and faults, the prediction model calculates, for instance, for each class a probability that a fault will be found in the class upon inspection.
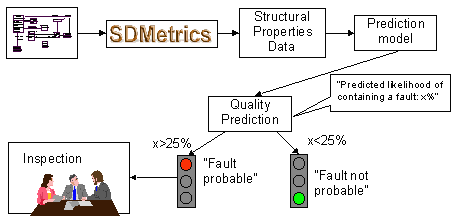
Figure 3: Using the Prediction Model
The output of the prediction model is useful for decision-making. For instance, we may decide that for classes with a high predicted fault-proneness, say, above 25%, the class design shall undergo quality assurance (QA) activities such as inspections, extensive unit testing etc. Or, we may rank the classes by their predicted fault-proneness, and select the highly fault-prone classes from the top of the list for QA activities, until the allocated resources for QA are depleted.
Thus, the effort for QA activities can be focused on the classes that are more likely to contain faults. The benefits are manifold:
- effectiveness of QA increases,
- system quality increases as more faults are found,
- development cost decreases as faults are found earlier when they are cheaper to repair.
Note: what kind of prediction the model makes - e.g., predicted number of faults, or the likelihood a fault is found in a class during inspection, testing, or post-release - depends on the statistical analysis techniques used, and the type of fault data from which the model is built.
Prediction models for other system qualities can be built in the same
way, for example, models to predict implementation and test effort
from design size.
In less mature organizations that do not regularly perform process
measurement to collect the required quality data, predicting the
implementation size (LOC) from design size is possible. The LOC
estimate may be useful for effort estimation.
The advantage of using prediction models is that they provide a mapping from hard-to-interpret design measurement data ("size=12, coupling=7, ...") to easily interpreted external quality data ("predicted fault-proneness of class X: 78%", "predicted effort to implement package Y: 104 person hours"). The result is an absolute, quantitative statement (within certain error bars) about the external quality of a system, expressed in the same unit in which the external quality is measured.
Also, prediction models address the problem that a complex system quality attribute such as fault-proneness is influenced by many factors - various dimensions of size, coupling and so on. Approaches such as quality benchmarks, which investigate one design metric at a time to characterize fault-proneness, fail to take the combined effect of all factors into account. Prediction models provide a sound method to combine these multiple factors into one cohesive model.
Empirical evidence shows that highly accurate prediction models can be built from structural properties, and that they are beneficial in highlighting trouble areas, as well as in supporting project planning and steering.
Top of page